I. Introduction
Our project focuses on the development of a machine-learning model for Fake News vs Real News Classification. The project builds upon previous research in the field of natural language processing (NLP) and machine learning, drawing inspiration from state-of-the-art techniques such as BERT (Bidirectional Encoder Representations from Transformers) and deep learning architectures. Through a combination of feature engineering, model training, and evaluation, we seek to develop a classification model that achieves high accuracy and generalization performance across diverse news datasets.
In addition to technical challenges, our project also addresses broader ethical and societal considerations surrounding the detection and classification of fake news. We recognize the importance of transparency, accountability, and responsible use of technology in combating misinformation and promoting media literacy.
Our project aims to contribute to the ongoing efforts to create a more trustworthy and reliable media landscape.
I.1 Motivation:
Detecting fake news is crucial given its importance. MIT researchers found false news stories are 70% more likely to be retweeted than true stories (Vosoughi et al., 2018). Pew Research Center reports that 64% of Americans believe fake news causes confusion about current events (Barthel et al., 2016). The spread of misinformation costs the global economy an estimated $78 billion (about $240 per person in the US) annually, according to the BBC (BBC, 2018). RAND Corporation research suggests fake news amplifies political polarization and threatens democratic norms (RAND Corporation, 2018). Despite efforts, 30% of social media users encounter fake news weekly (Statista, 2022). Therefore, accurate text-based fake news detection models are essential to combat misinformation and protect democratic processes.
Thus, the widespread dissemination of fake news poses a significant threat to various aspects of society, including:
- Undermining trust in credible information sources.
- Misleadingly swaying individuals’ opinions on critical issues.
- Fueling existing societal divides.
By leveraging BERT, Logistic Regression, and SVMs, this project aims to produce a fake news detection system that contributes to tackling the challenges posed by fake news.
I.2 Literature Review
Researchers have explored various approaches to address this challenge, employing both traditional machine learning algorithms and advanced deep learning models to develop fake news detection systems.
Traditional Machine Learning Approaches:
- Castillo et al.,[2] in 2011 and Conroy et al.,[3] in 2015 utilized algorithms like SVMs, Decision Trees, and Logistic Regression with handcrafted features to tackle fake news.
- They focused on text characteristics and metadata, requiring extensive feature engineering.
- Jain et al.,[13] utilize Naive Bayes classification capabilities to predict whether Facebook posts will be labelled as “real news” or “fake news”.
- Reis et al.,[14] use several supervised learning algorithms to measure the effectiveness of their classification abilities while considering features such as lexical features, domain location (for urls), engagement, temporal patterns, etc.
Advancements with Deep Learning:
- Zhou et al[4] adopted RNNs and CNNs for processing sequential data and capturing local text patterns to differentiate between real and fake news.
- Monti et al[11] use geometric deep learning in order to detect fake news titles on social media.
- Deep learning models excel in learning features directly from text without manual extraction.
BERT and Transformer Models:
- Devlin et al. [5] introduced BERT as a significant advance in fake new classification with its bidirectional training and attention mechanisms.
- Demonstrated superior performance in understanding context and semantic relationships in text[6].
I.3 Dataset Description
Our data are Json files publicly available and stored on web; therefore, we download it via GCS storage APIs and convert it into pandas dataframe. We download the data in 4 files:
- Training – Training dataset of real news. Dataset link
- Testing – Testing dataset of real news. Dataset link
- Training – Training dataset of fake news. Dataset link
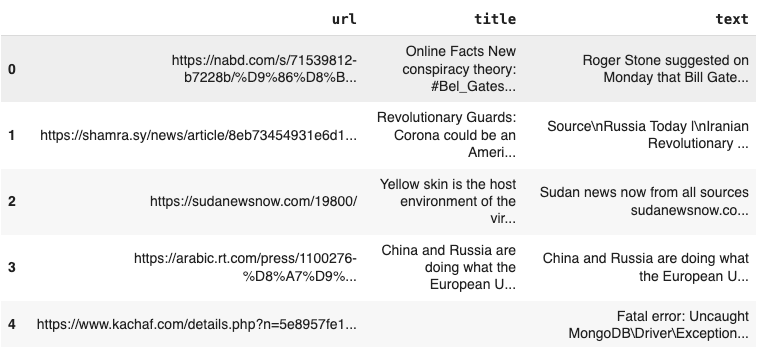
- Testing – Testing dataset of fake news. Dataset link There are 800 rows and 3 columns (url, title, text) for real and fake news news in their respective training sets, we will only use the ‘text’ column for modeling (for simplicity’s sake).
Here is a quick snapshot of the training dataset for real news (Please see the Colab notebook in GitHub repository for more details).
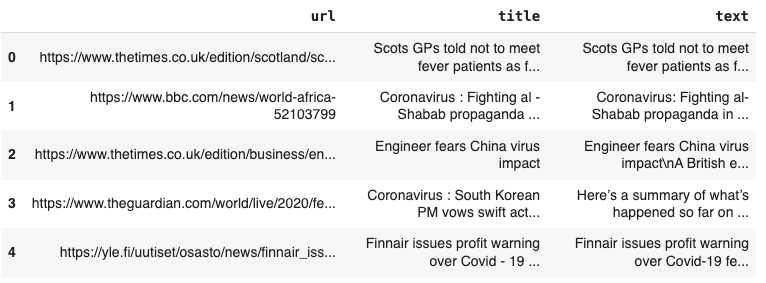
Here is a quick snapshot of the training dataset for fake news (Please see the Colab notebook in GitHub repository for more details).
To train, validate, and evaluate the performance of our Fake News or Real News Classification model, we divided our dataset into three distinct subsets: training, validation, and testing.
- Training Dataset: The training dataset comprised the largest portion of our data and was used to train the model’s parameters. It consisted of a diverse collection of labeled news articles, including both real and fake news samples. This dataset served as the foundation for the model to learn the underlying patterns and features associated with each class.
- Validation Dataset: The validation dataset was used to fine-tune the model’s hyperparameters and monitor its performance during training. It provided an independent set of data samples that the model did not see during training, allowing us to assess its generalization ability and prevent overfitting. The validation dataset played a crucial role in optimizing the model’s architecture and training process.
- Testing Dataset: The testing dataset served as the final benchmark to evaluate the model’s performance after training and validation. It consisted of a separate set of news articles, again with labels indicating their authenticity. The model’s predictions on the testing dataset were compared against the ground truth labels to assess its accuracy, precision, recall, and other performance metrics. This dataset provided valuable insights into the model’s real-world effectiveness and its ability to accurately classify unseen news articles.
II. Problem Definition
Our goal is to develop a machine-learning model capable of distinguishing between fake and real news articles. Given a dataset of news articles, the objective is to first identify real and fake news articles through data pre-processing, label them and then train a classification model to accurately identify the authenticity of unseen news articles as either fake or real.
II.1 Scope:
We aim to use ML algorithms to perform fake news detection based on textual features only. What we do not cover in our project is verifying the authenticity of visual content other than text such as images and videos. Using the help of external sources, we built our code to solve the issue stated above (see appendix for code references).
II.2 Change in Research Direction:
Our research initially focused on detecting fake news using structural and language features without verifying content truthfulness and focusing more on user modeling because we realized that was a more challenging problem to solve and leveraged GNNs. Additionally, due to Twitter’s privacy laws, we could not view the dataset features necessary to utilize GNNs. Hence, we have refined our approach to concentrate on Fake News or Real News Classification using BERT.
Shifting our focus allows us to provide a more specific solution to the broader issue of misinformation by classifying news articles as either fake or real, we aim to empower users to discern the authenticity of news sources and combat the spread of misinformation.
III. Methods: (BERT, Logistic regression, SVMs)
In this project, we aimed to develop a robust model for detecting fake news. We employed three different machine-learning algorithms:
- Logistic regression,
- BERT (Bidirectional Encoder Representations from Transformers), and
- Support Vector Machines (SVM).
This report focuses on the implementation and evaluation of logistic regression as the baseline model and compares the results with BERT and SVM.
III.1 Logistic Regression:
Logistic regression is a well-suited algorithm for binary classification tasks like real vs. fake news detection. We started with the hypothesis that it will learn a separating hyperplane between the two classes (real and fake) like the extracted BERT features. We used logistic regression as a baseline and compared the results with BERT and SVM. New unseen news articles can then be classified as real or fake based on their position relative to the learned hyperplane in the feature space.
Data Preprocessing Method Implemented for Logistic Regression:
We employed the following method for preparing the data for logistic regression analysis. We have included the key steps below:
-
Text Cleaning Function: We implemented a robust text cleaning function to ensure the text data was standardized and free from unnecessary characters. This function removed apostrophes, special characters, and non-alphanumeric symbols from the text while also converting all text to lowercase. This step aimed to eliminate noise and ensure consistency in text representation.
-
Stop word Removal: Stop words, commonly occurring words that add little value to the classification task, were removed from the text data. This included words such as “and,” “the,” and “is.” By excluding stop words, we aimed to streamline the text data and focus on meaningful content relevant to the classification task.
-
Tokenization and Word Count: We tokenize the text data, splitting it into individual words or tokens. Additionally, we calculated the word count for each text sample, providing insights into the distribution of text lengths within the dataset. Visualizations such as histograms were utilized to analyze the distribution of word counts across real and fake news samples.
-
Word Cloud Visualization: To gain further insights into the most frequent words within real and fake news samples, we generated word cloud visualizations. These visualizations highlighted the most prominent words in each category, offering a glimpse into the vocabulary associated with real and fake news articles.
By executing these data cleaning steps, we ensured that the text data was appropriately formatted and ready for further processing, such as feature extraction and model training using logistic regression.
III.2 BERT for Feature extraction, classification, training, and evaluation:
We leverage Bidirectional Encoder Representations from Transformers (BERT), a powerful pre-trained language model, to encode textual data from news articles. Since BERT excels at capturing semantic relationships between words and contextual meaning within sentences, we chose it as a primary tool for detecting fake news.
During training, the provided code utilizes a pre-trained BERT model (‘bert-base-uncased’) to transform preprocessed news text into numerical representations. These representations act as features that capture the essence of the news content.
Data Preprocessing Method Implemented for BERT:
We preprocessed our original text into input features BERT can read. The process is tokenizing and converting our original text into token IDs that can be read by the algorithm. The words are tokenized based on the vocabulary dictionary it was pretrained on (vocabulary size of 30,522 words), and unknown words are broken down into smaller words contained in the dictionary. Maximum sequence length is also specified so we can pad all sequences into the same length. However, please note that the final sequence length would be larger than specified since the BERT tokenizer breaks unknown words into multiple small known words.
Since the BERT algorithm can only accept sentence lengths up to 512 words, we need to preprocess our data (long news) to feed into the algorithm. To do so, we follow the idea from this paper and segment each of the text into multiple subtexts of no longer than 150 words. The subtexts will have some overlapping, specifically, the last 30 words for the first subtext will be the first 30 words of the second subtext.
We incorporated several data preprocessing steps to prepare the news text data for BERT and logistic regression:
-
Text Cleaning: We removed punctuation, converted text to lowercase, and handled extra spaces to standardize the text format. This ensures consistent processing by BERT and avoids introducing noise due to formatting variations.
-
Text Splitting: We split each news article into subtexts with a maximum length of 150 words. This step caters to the input requirements of BERT, which has limitations on the sequence length it can process effectively.
-
BERT Tokenization: We use a pre-trained BERT tokenizer (‘bert-base-uncased’) to convert text into numerical tokens (ids) that BERT understands. This allows BERT to process the textual data and extract meaningful features.
-
Padding and Truncation: We padded shorter sequences with zeros and truncated longer sequences to a fixed length (‘max_seq_len’) to ensure consistent input size for BERT. This step ensures all inputs are compatible with the BERT model’s architecture.
Thus, by carefully preparing and padding our input data, we ensured that our Fake News or Real News Classification model received standardized inputs, allowing it to effectively learn and make accurate predictions on news articles of varying lengths and complexities.
III.3 Support Vector Machines (SVM):
Support vector machine is a machine learning technique well-suited to binary classification tasks. SVMs use a subset of datapoints from different classes which are the closest in feature space as “support vectors” –they allow the model to learn and create a separating hyperplane between labeled classes. By utilizing the kernel trick, SVMs map the input space into a high-dimensional latent space to capture complex nonlinear relationships using linear decision boundaries. We hypothesize that by encoding textual features into a vectorized form, SVMs will be able to learn a separating hyperplane between real and fake news sources. This will allow us to classify unseen examples of news sources based on their relative position to the learned hyperplane.
Data Preprocessing Method Implemented for SVM:
-
Text cleaning: To preprocess the textual data for SVM modeling, we first cleaned the text by removing punctuation, and extra whitespace, and converting the text to lowercase.
-
Feature Extraction: To convert the cleaned textual information into a usable form for machine learning methods, we next extracted vector features from the text using TF-IDF (term frequency-inverse document frequency) which encodes the relevance of textual tokens by measuring their prevalence within and across documents.
These data cleaning steps ensured that the text data was appropriately formatted and suitable for machine learning processing and analysis via support vector machines.
IV. Results and Discussion:
IV.1 Visualizations
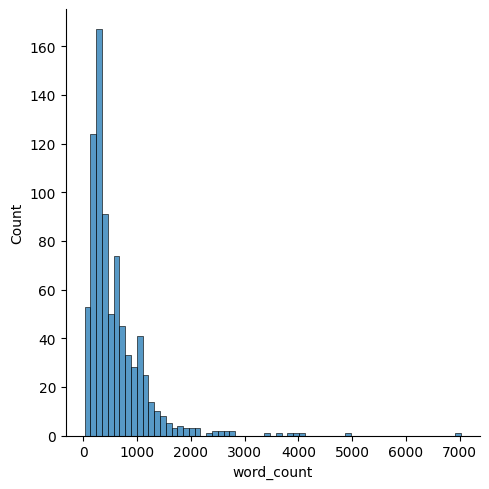
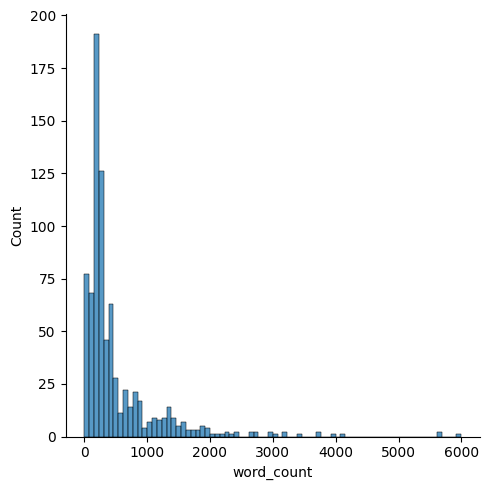
We used the training set to perform exploratory data analysis. First, we wanted to look at the word count for each news and see if there is a difference between real and fake news. We can see in the below graph that most real news is within 1000 words, and the distribution of word count is skewed to the right.
As for the fake news, we see some outliers from the below graph making it hard to interpret. So, we plot it again below with the outlier (news that has more than 20,000 words) removed.
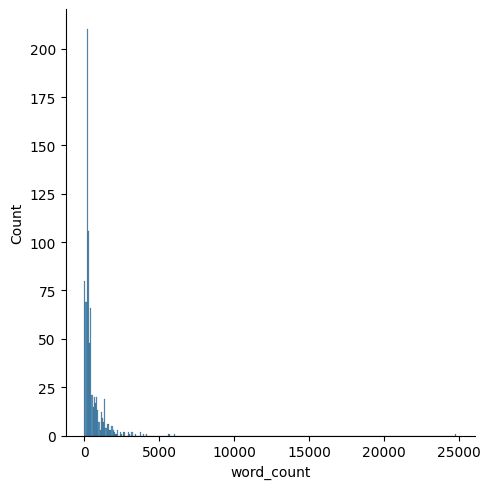
The below graph shows a fake news training dataset with outliers (>20,000 words removed)
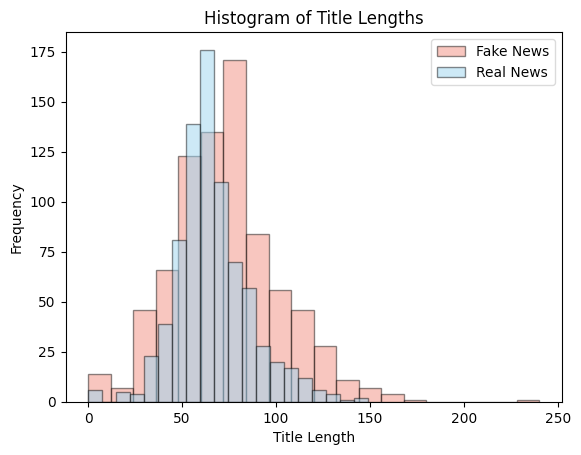
The histogram below depicts frequencies of titles based on title length (number of characters in title) for both real and fake news.
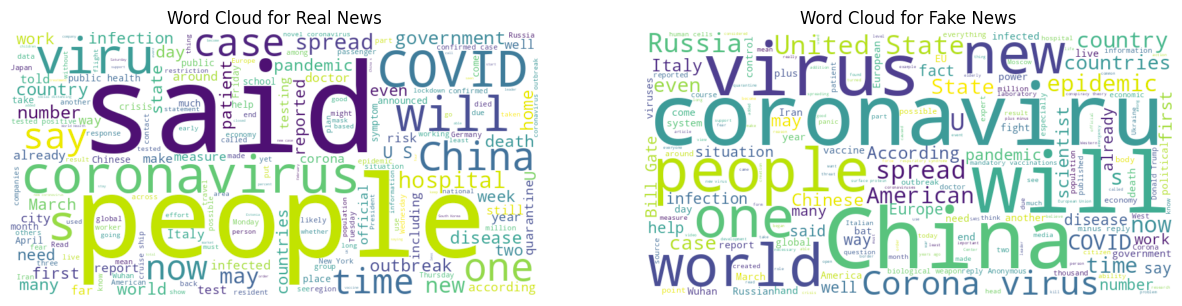
The word cloud for real vs fake news based on news text is depicted below. We can see most of the real news is about the COVID-19 virus, and the common words are names of countries and other neutral words.
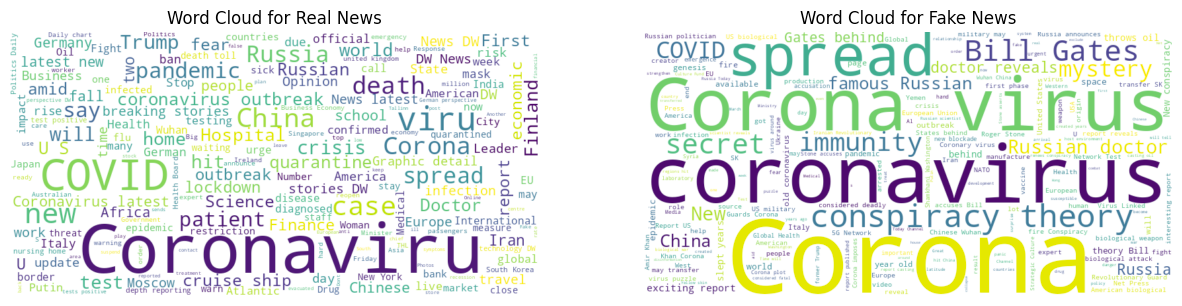
A similar word cloud is obtained for real and fake news, but only based on the title and inserted below. The topics seem to be the same for fake news. However, it contains distinguishable words. For example, Bill Gates is spelled wrongly in some instances. Additionally, there are a few standalone letters such as “u”.
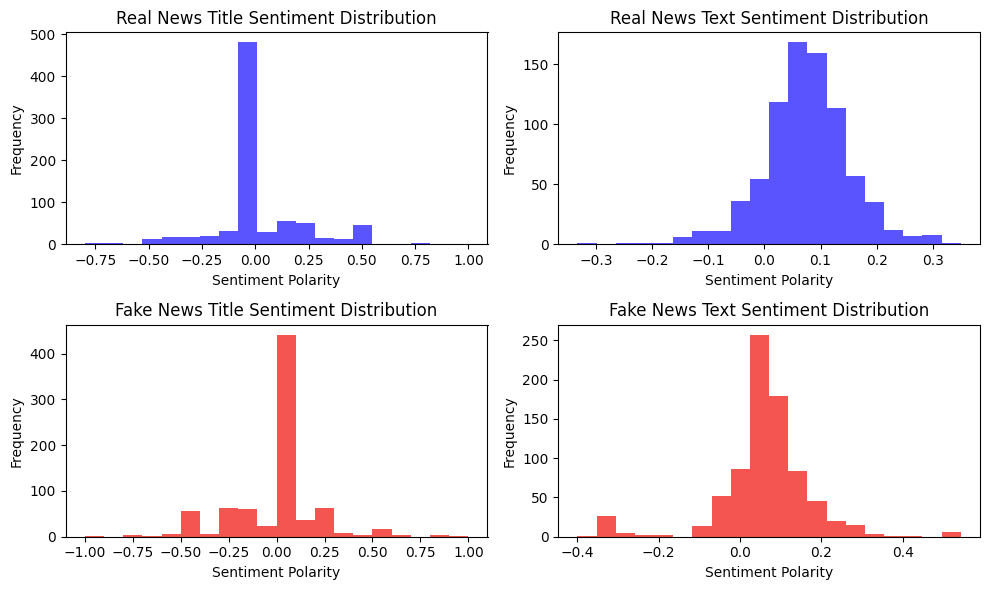
To gain a better understanding of the sentiments across real vs fake news across titles as well as texts, their sentiments were analyzed, and their polarities are represented in the plots below.
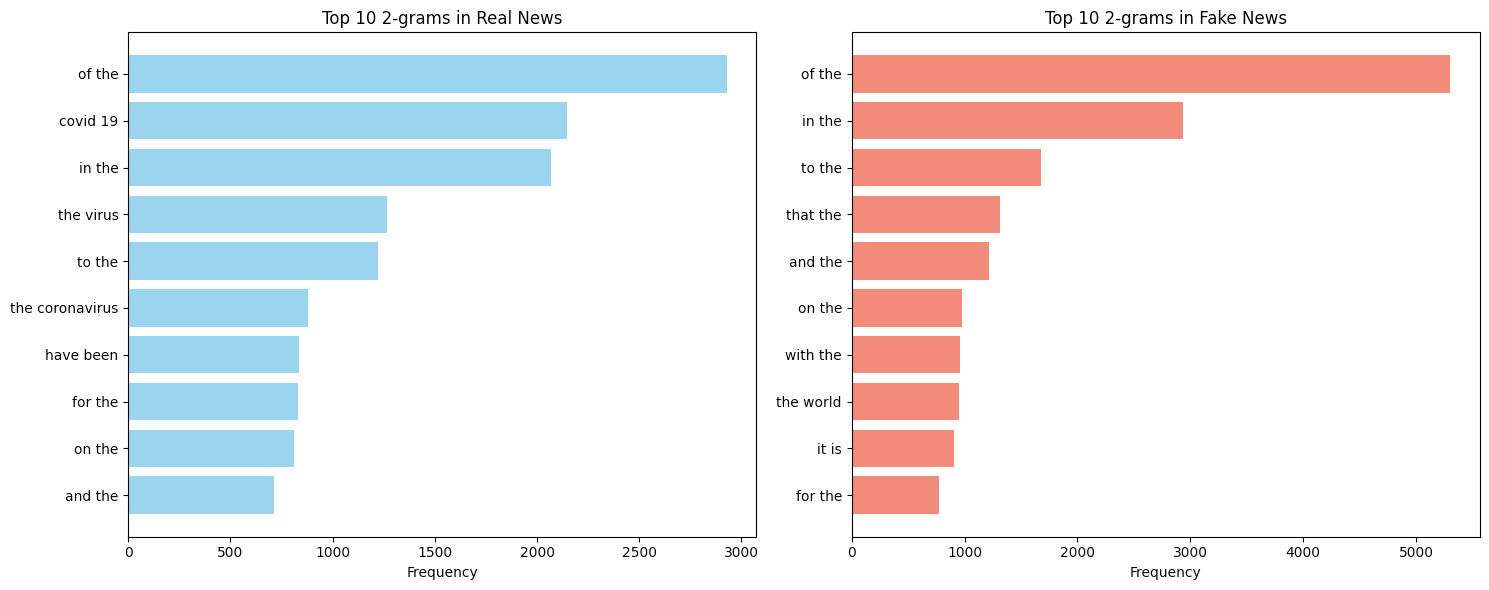
The plots below show the N-gram analysis conducted to obtain the top 10 n-gram phrases and/or words in real and fake news titles and texts respectively.
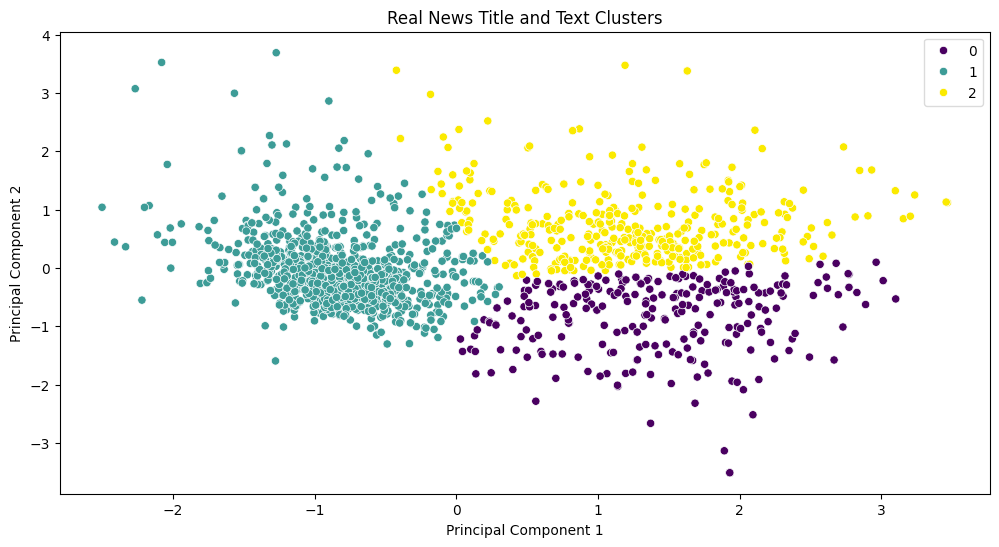
The plot below shows the clustering of word embeddings for real and fake news. Word2Vec is used to represent words in titles and texts as dense vectors. The clustering algorithm is used to cluster similar titles and texts together and visualize the clusters.

Next, we wanted to see the Top “k” word proportion of the real/fake news. In other words, we wanted to see how many of the words used in the news are from the top 10 common words, the top 100, and so on. We hypothesized that since fake news is machine-generated it will likely use many high-frequency words compared to real news.
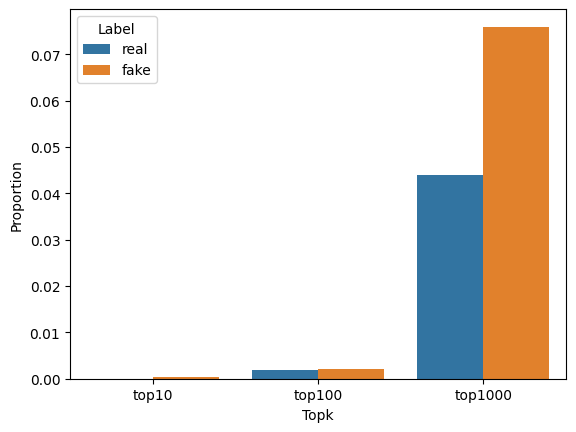
Our analysis confirmed our hypothesis, and we see from the above bar chart that the difference is significant only for the Top 1000 most frequently used words.
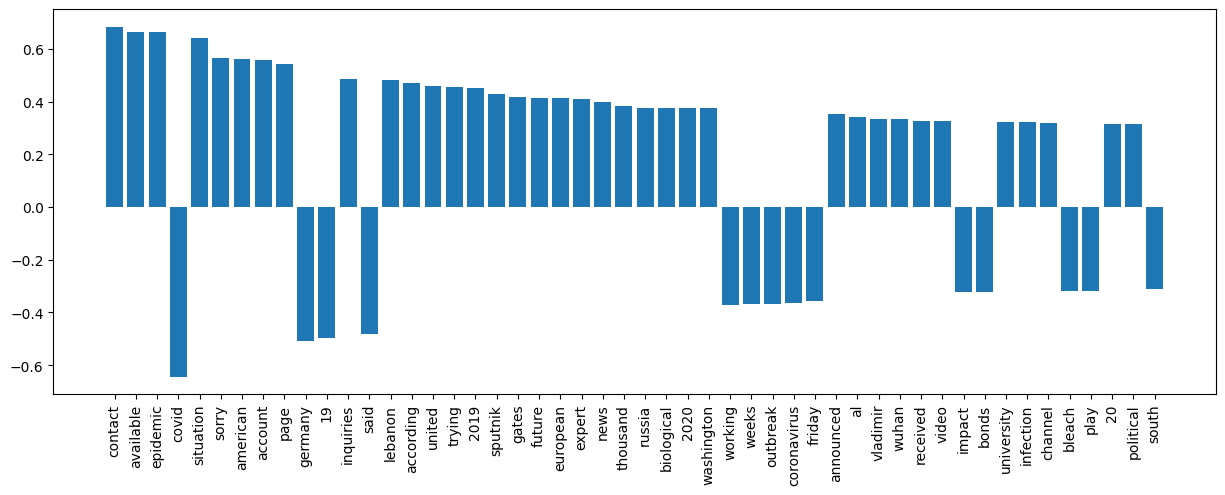
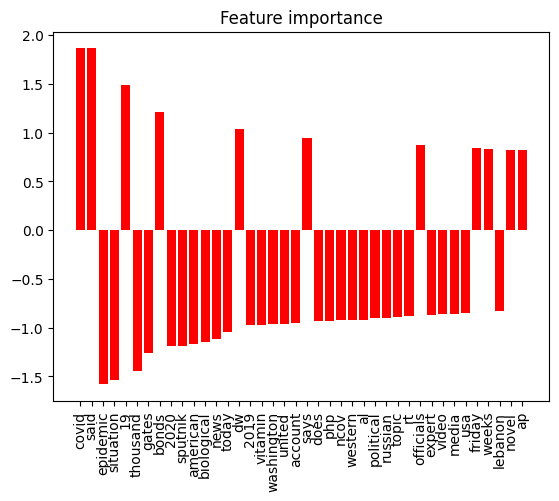
Analysis of Feature Importance
We further extract the coefficients of the logistic regression and SVM models to identify the top 50 important features contributing to its predictions. By sorting the coefficients in descending order, the most influential features are determined. These features are then plotted on a bar chart, providing a visual representation of their importance.
The x-axis of the plot below displays the top features, while the y-axis represents their corresponding coefficients. This visualization offers valuable insights into which features have the most significant impact on the model’s predictions. It helps interpret the model’s decision-making process and aids in understanding the importance of different features from the news data, as well as helping in feature selection, dimensionality reduction, and improving the model’s performance by just focusing on the most important features.
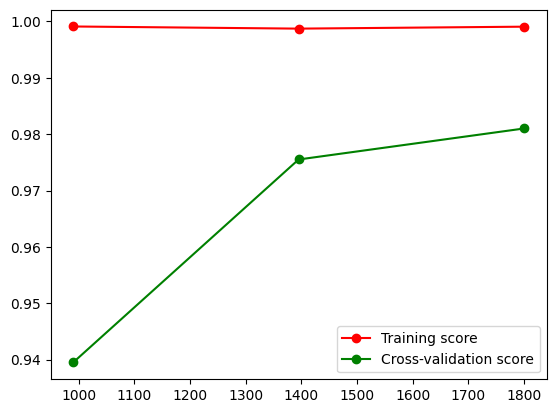
#### Learning Curve
We implemented a learning curve for the SVM model to visualize the validation and training score of the model for varying numbers of training samples. This can help us find out how much we benefit from adding more data whether the estimator suffers more from variance error or bias error.
IV.2 Quantitative Metrics
After we trained the model, we evaluated the training set, the validation set, and the test set. We used the following metrics:
- Accuracy: 97%
- Precision: 94.76%
- Recall: 99.5%
- F1 Score: 97.07%
- AUC (Area under the Curve) - to get a more thorough evaluation of our model: 99.57%
IV.3 Evaluation Observations:
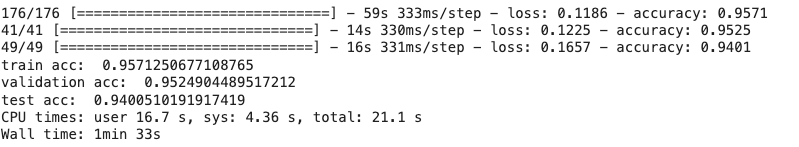
IV.3.1 Bert Model
We can see that we have about ~approx. 96.0 % accuracy for the training set and about 940 % accuracy for our validation set.
The prediction is on the augmented test set, but this needs to be translated to the prediction of the original text. Therefore, for each original text, we should average the probability of each subtext and obtain a final prediction for that piece of news. Metrics:
- Accuracy = 0.97
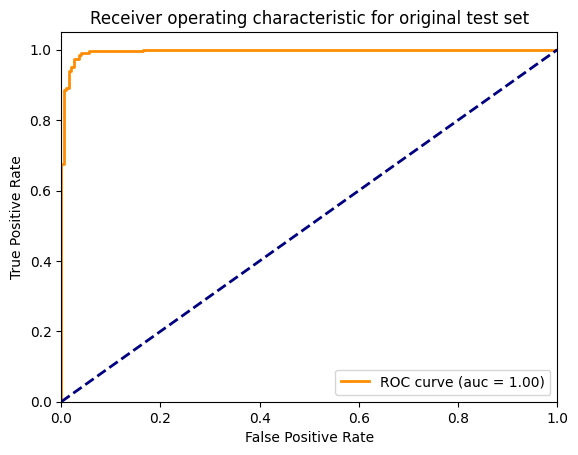
- Roc Auc Score = 0.99
- Precision = 0.96
- F1_score = 0.97
- Recall = 0.98
IV.3.2 Logistic Regression
Compared to the Bert Model, the logistic regression model performed lower with a test accuracy of approximately 96% and an F1 score of 96%.
Logistic Regression Metrics:
- Accuracy = 0.959
- Roc Auc Score = 0.99
- Precision = 0.951
- F1_score = 0.96
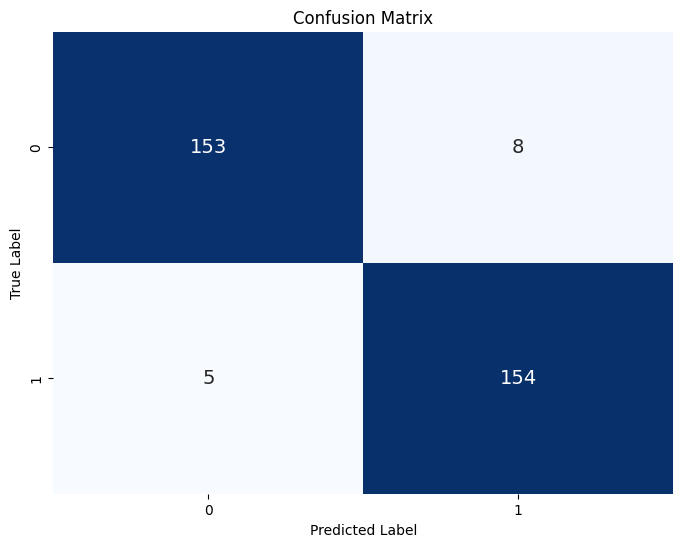
- Confusion Matrix
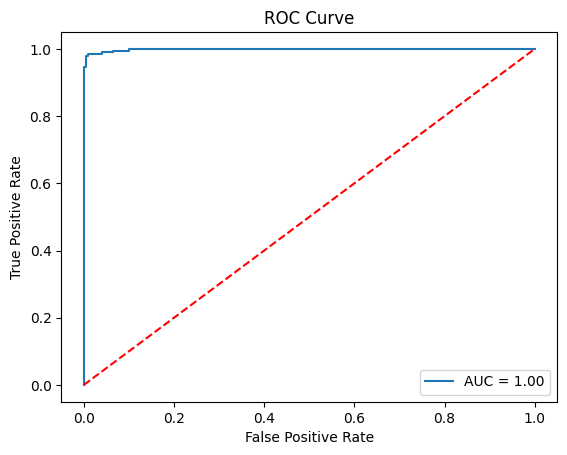
- ROC Curve
IV.3.3 Support Vector Machine SVM
Compared to the previous two models, the Support Vector Machine model performed better with a training accuracy of 99% and a test accuracy of approximately 97%. Unlike the logistic regression and Bert models, the SVM model had little data preprocessing which may explain the discrepancy in results.
SVM Metrics:
- Accuracy = 0.98
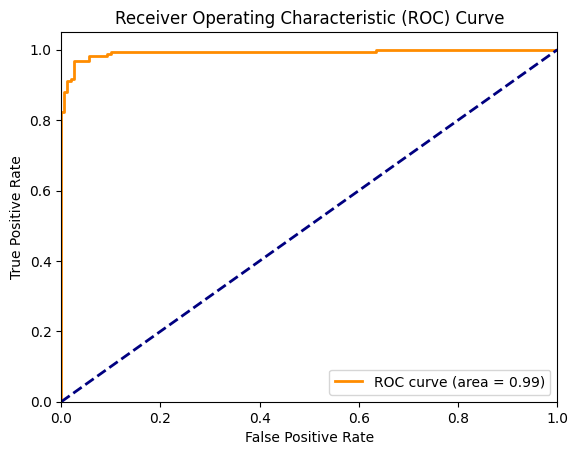
- Roc AUC Score = 0.98
- Precision = 0.97
- F1_score = 0.98
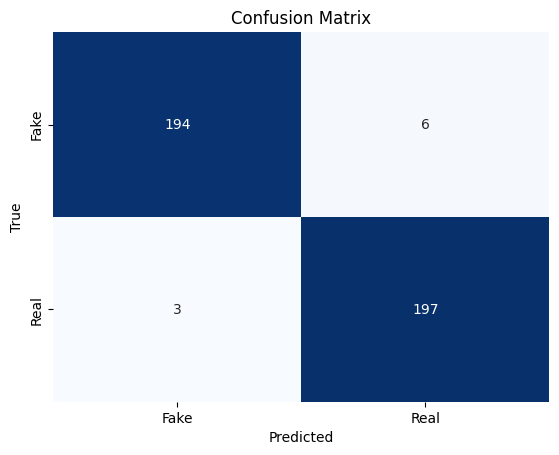
- Confusion matrix
- ROC Curve
IV.4 Analysis of Bert Model
In this project, BERT is employed as a feature extractor. It takes raw text data as input and produces high-dimensional vectors as output, capturing the semantic meaning and context of the text. As expected, pre-trained on massive text corpora, BERT captured semantic relationships and nuances in language that might be difficult for simpler feature extraction techniques. Our metrics showed great results. Even AUC was shown hugging the top-left corner indicating that our model was performing well. If our planned implementation of the Logistic Regression model achieves high accuracy, precision, recall, and F1-score, it suggests BERT is capturing relevant information for fake news classification. We think that
Additionally, by learning a lower-dimensional representation of text, BERT can potentially improve the efficiency and performance of the final classification model (Logistic Regression).
We think that one of our key advantages of using BERT was its pre-training on large corpora of text data. During pre-training, BERT learns to predict missing words in sentences, masked tokens, and sentence relationships, which imbues it with a robust understanding of language. This pre-trained knowledge is leveraged in the project by fine-tuning BERT on the specific task of fake news detection. Hence, we were able to get excellent metrics.
IV.5 Analysis of Logistic Regression Model:
The logistic regression model exhibits notable performance across multiple evaluation metrics, underscoring its efficacy in discriminating between real and fake news articles. With an accuracy of 95.94%, the model demonstrates a prominent level of overall correctness in its predictions. Moreover, precision stands at 95.06%, indicating the model’s ability to accurately identify fake news instances among the positive predictions. A noteworthy recall score of 96.86% further accentuates the model’s capacity to correctly detect a substantial portion of all actual positive instances in the dataset.
Further evaluation through the receiver operating characteristic (ROC) curve and area under the curve (AUC) score reveals a robust discrimination ability, with an AUC score of 99.20%. This metric illustrates the model’s proficiency in distinguishing between true positive and false positive rates across various threshold values. The confusion matrix analysis unveils minimal misclassifications, with only 13 instances out of 320 being incorrectly classified. These misclassifications primarily consist of false positives and false negatives, indicating areas where the model may benefit from refinement to minimize such errors.
In conclusion, the logistic regression model emerges as a potent tool for discerning between real and fake news articles, as evidenced by its impressive accuracy, precision, recall, and ROC AUC score.
IV.6 Analysis of Support Vector Machine(SVM):
The support vector machine model exhibits superior performance across multiple evaluation metrics, demonstrating its robust ability to classify real vs fake news articles. With an accuracy of 98%, the model demonstrates a high probability of correct predictions. Moreover, a precision of 97% indicates the model’s ability to accurately identify fake news instances among the positive predictions.
Further evaluation through the receiver operating characteristic (ROC) curve and area under the curve (AUC) score highlights SVM’s ability to distinguish between positive and negative samples across various threshold values, with an AUC score of 98%. The confusion matrix analysis reveals minimal misclassifications, with only 9 instances out of 320 being incorrectly classified. Specifically, these misclassifications primarily consist of false positives, indicating how the model might be refined to minimize prediction errors.
In conclusion, the SVM model emerges as a potent tool for discerning between real and fake news articles, as evidenced by its impressive accuracy, precision, recall, and ROC AUC score.
IV.7. Tradeoffs, Strengths, and Limitations:
In comparing the three approaches of BERT-Uncased, Logistic Regression, and Support Vector Machine (SVM) for fake news detection, we uncover distinct tradeoffs, strengths, and limitations.
-
BERT-Uncased excels in capturing intricate semantic relationships within text, yielding robust performance. However, its resource-intensive nature and complexity limit scalability, particularly with large datasets.
-
Logistic Regression, while computationally efficient and interpretable, struggles with capturing non-linear patterns inherent in language, potentially leading to suboptimal performance.
-
SVM, leveraging a robust margin-based classification mechanism, offers competitive accuracy but suffers from scalability issues due to its quadratic time complexity concerning the number of samples.
IV.8. Challenges and Future Work:
The visualization and metrics highlight SVM and BERT-Uncased’s superior performance in discriminating between real and fake news, evident in its high accuracy, precision, recall, and F1 score. Logistic Regression and SVM, while exhibiting respectable performance, fall short in capturing the nuanced relationships present in text data, resulting in slightly lower metrics. The models’ comparative analysis highlights SVM as the top-performing approach, followed by Bert and Logistic Regression, indicating the importance of leveraging deep contextual embeddings for fake news detection tasks. We think that BERT will benefit more from hyperparameter tuning and will likely be better than SVM. However, we could not test it further due to lack of GPU support.
Moving forward, potential next steps involve fine-tuning hyperparameters, exploring ensemble methods to leverage the strengths of multiple models, and considering model distillation techniques to reduce BERT’s computational overhead. Additionally, incorporating domain-specific features and conducting further analysis on misclassified instances can enhance model robustness and generalization capabilities, advancing fake news detection efforts.
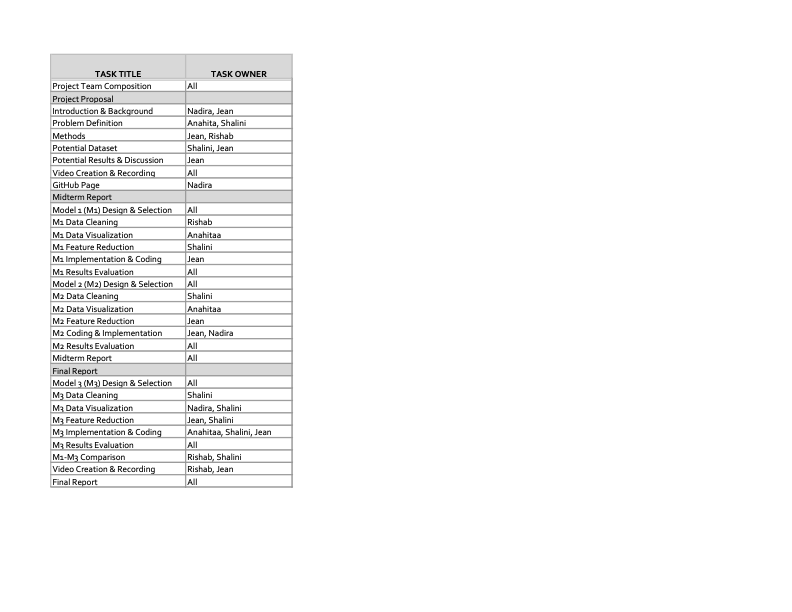
Gantt Chart:
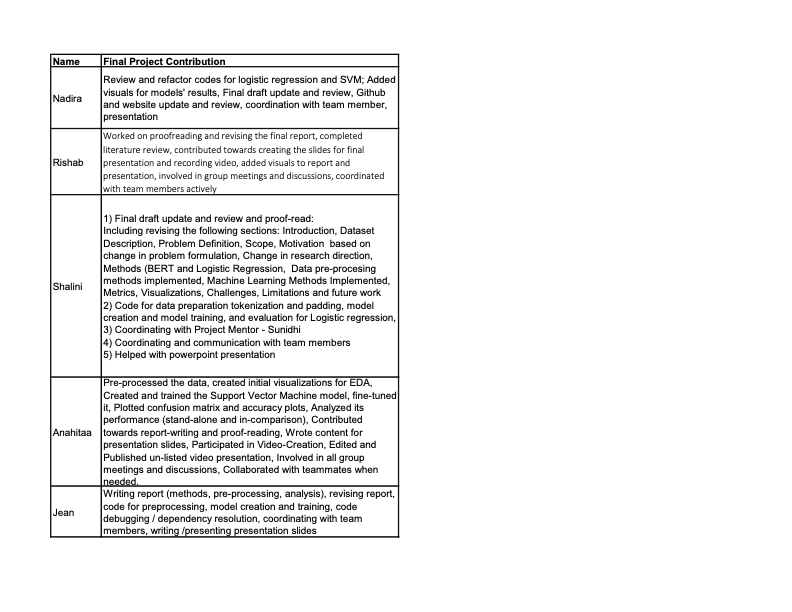
Contribution table:
References:
- Agarwal, C., Queen, O., Lakkaraju, H. et al. Evaluating explainability for graph neural networks. Sci Data 10, 144 (2023). https://doi.org/10.1038/s41597-023-01974-x
- Castillo, C., Mendoza, M., & Poblete, B. (2011). Information credibility on Twitter. In Proceedings of the 20th international conference on World wide web (pp. 675-684).
- Conroy, N. K., Rubin, V. L., & Chen, Y. (2015). Automatic deception detection: Methods for finding fake news. Proceedings of the association for information science and technology, 52(1), 1-4.
- Zhou, X., & Zafarani, R. (2019). Network-based fake news detection: A pattern-driven approach. ACM SIGKDD explorations newsletter, 21(2), 48-60.
- Devlin, J., Chang, M. W., Lee, K., & Toutanova, K. (2018). Bert: Pre-training of deep bidirectional transformers for language understanding. arXiv preprint arXiv:1810.04805.
- Yang, J., Wang, M., Zhou, H., Zhao, C., Zhang, W., Yu, Y., & Li, L. (2020, April). Towards making the most of bert in neural machine translation. In Proceedings of the AAAI conference on artificial intelligence (Vol. 34, No. 05, pp. 9378-9385).
- Shu, K., Sliva, A., Wang, S., Tang, J., & Liu, H. (2017). Fake news detection on social media: A data mining perspective. ACM SIGKDD Explorations Newsletter, 19(1), 22-36.
- Sundararajan, M., Taly, A., & Yan, Q. (2017). Axiomatic Attribution for Deep Networks. International Conference on Machine Learning.
- Vu, M.N., & Thai, M.T. (2020). PGM-Explainer: Probabilistic Graphical Model Explanations for Graph Neural Networks. ArXiv, abs/2010.05788.
- Ying, R., Bourgeois, D., You, J., Zitnik, M., & Leskovec, J. (2019). GNNExplainer: Generating Explanations for Graph Neural Networks. Advances in neural information processing systems, 32, 9240-9251 .
- Monti, Federico, et al. “Fake news detection on social media using geometric deep learning.” arXiv preprint arXiv:1902.06673 (2019).
- Zhang, X., & Ghorbani, A. A. (2020). An overview of online fake news: Characterization, detection, and discussion. Information Processing & Management, 57(2), 102025.
- Jain, A., & Kasbe, A. (2018, February). Fake news detection. In 2018 IEEE International Students’ Conference on Electrical, Electronics and Computer Science (SCEECS) (pp. 1-5). IEEE.
- Reis, J. C., Correia, A., Murai, F., Veloso, A., & Benevenuto, F. (2019). Supervised learning for fake news detection. IEEE Intelligent Systems, 34(2), 76-81.
- Statics1
- Statics2
- Statics3
- Statics4
- Statics5